|
|
| WELCOME TO PROPERTY
STATISTICS! |

The Official
Website
Travel, Explore, Discover, Invest,
Business Setup and/or Do Business, Learn and Enjoy at
Iskandar Malaysia
Places to Invest, Setup Business and Do Business
along the Maritime Silk Road
Enquire or Book an InvestoVisit Online Now
Asian Property
Statistics Source
(June 2018 Update) |
Comparative
Statistics Source from
Asian Property Statistics Guide
to Assist
Your Decision-Making
|
|
Asia: Square meter prices, premier city
center, US$.
Average per square meter (sq. m.) prices in US$/€
of 120-sq. m. apartments located in the center of
the most important city of each country, either the:
Administrative capital; and/or Financial capital;
and/or The center of the rental market (according to
Global Property Guide)
Square Meter Prices (USD)
|
Hong Kong |
 $ 26,325
 |
| Japan |
$ 16,322 |
| India |
$ 15,525 |
| Singapore |
$ 13,748 |
| China |
$ 11,829 |
| Taiwan |
$ 7,112 |
| Thailand |
$ 3,952 |
| Philippines |
$ 3,952 |
| Malaysia
|
$ 3,441 |
| Cambodia |
$ 2,913 |
| Indonesia |
$ 2,889 |
| |
|
|
Asia: Gross rental yields (%).
The gross annual rental income, expressed as a
percentage of property purchase price. This is what
a landlord can expect as return on his investment
before taxes, maintenance fees and other costs.
(according to Global Property Guide)
Rental Yields
| Indonesia |
8.61% |
| Philippines |
6.13% |
| Cambodia |
5.33% |
|
Thailand |
5.13% |
|
Malaysia |
3.72% |
| Japan |
2.66% |
| Hong Kong |
2.62% |
| Singapore |
2.54% |
| China |
2.10% |
| Taiwan |
1.57% |
|
Asia: Rents in USD
Asia has
surprisingly good house price statistics, though the
quality varies greatly. The ex-British colonies tend
to have good house price statistics Hong Kong,
Singapore and Malaysia all have excellent houses
price time series. (according to Global Property
Guide)
Rents
| Hong Kong |
$7,470 |
| Japan |
$4,346 |
| Singapore |
$3,498 |
| South Korea |
$2,778 |
| Indonesia |
$2,486 |
| China |
$2,479 |
| Philippines |
$2,422 |
| India |
$2,275 |
| Thailand |
$2,029 |
| Cambodia |
$1,553 |
| Malaysia
|
$1,281 |
| Vietnam |
$1,148 |
| Taiwan |
$1,117 |
| |
|
|
Asia: Price/rent ratio
This ratio is typically used for measuring
undervaluation/overvaluation of real estate prices,
calculated by dividing the gross rental yield by 100
so the higher the yield, the lower the price/rent
ratio. (according to Global Property Guide)
Price/Rent Ratio
| Taiwan |
64 yrs |
| China |
48 yrs |
| Singapore |
39 yrs |
| Hong Kong |
38 yrs |
| Japan |
38 yrs |
|
Malaysia |
27 yrs |
| Thailand |
19 yrs |
| Cambodia |
19 yrs |
| Philippines |
16 yrs |
| Indonesia |
12 yrs |
|
Asia: House price to income ratio
The house price to income ratio is the ratio of
the cost of a typical upscale housing unit of 100
square meters, compared to the countrys GDP per
capita. Normally this ratio will be much higher in
low income countries than in high income countries.
(according to Global Property Guide)
Price/GDP per Cap
|
India |
891.22x |
|
Cambodia |
227.93x |
| China |
145.62x |
|
Philippines |
135.02x |
| Indonesia |
80.16x |
| Thailand |
66.96x |
| Hong Kong |
60.43x |
| Japan |
41.98x |
|
Malaysia |
36.71x |
| Taiwan |
31.61x |
| Singapore |
25.96x |
|
Asia: Round trip transaction costs (%).
The total cost of buying and then re-selling a
residential property, including all costs (except
the sale price itself), expressed as percentage of
the property value.
Transaction costs can be broken down into four
major cost areas: Registration costs, Real estate
agent fees, Legal fees, Sales and transfer taxes and
does NOT include other incidental costs such as
survey fees, residency permit cost, or company setup
costs. (according to Global Property Guide)
Buy/Sell Costs
| Sri Lanka |
107.60% |
| Hong Kong |
34.11% |
| Macau |
27.60% |
| South Korea |
23.98% |
| Singapore |
23.95% |
|
Indonesia |
17.20% |
| Japan |
13.36% |
| India |
11.88% |
| Georgia |
11.80% |
| Thailand |
10.90% |
| Taiwan |
9.93% |
| Philippines |
8.63% |
| Pakistan |
8.00% |
| Cambodia |
7.70% |
| Bangladesh |
6.50% |
| Mongolia |
6.05% |
| Vietnam |
5.57% |
| China |
5.35% |
| Malaysia
|
5.18% |
| Myanmar |
5.00% |
| Nepal |
2.78% |
| |
|
|
Asia: Rental income taxes (%).
The tax levied on the average annual income on a
rental apartment/property in the country. (according
to Global Property Guide)
Rental Income Tax
| Bangladesh |
30.00% |
| Nepal |
25.00% |
| Taiwan |
25.00% |
|
Malaysia |
22.40% |
| Vietnam |
20.00% |
| Uzbekistan |
20.00% |
| Indonesia |
20.00% |
| Singapore |
15.13% |
| Kazakhstan |
15.00% |
| Sri Lanka |
14.81% |
| Cambodia |
14.00% |
| Azerbaijan |
14.00% |
| Pakistan |
11.40% |
| Hong Kong |
11.40% |
| Mongolia |
10.00% |
| Macau |
8.76% |
| India |
7.87% |
| Myanmar |
7.50% |
| Laos |
7.50% |
| Georgia |
5.00% |
| China |
5.00% |
| Philippines |
4.06% |
| Japan |
3.40% |
| Thailand |
2.73% |
| South Korea |
0.00% |
| |
|
| |
|
|
Asia: Capital gains taxes (%).
This is effective capital gains tax rates by the
Global Property Guide with assumptions. (according
to Global Property Guide)
Capital Gains Tax
| South Korea |
42.00% |
| Philippines |
32.00% |
| India |
30.00% |
| Bangladesh |
30.00% |
| Thailand |
30.00% |
| Nepal |
25.00% |
| Azerbaijan |
25.00% |
| Laos |
24.00% |
| Uzbekistan |
20.00% |
| Taiwan |
20.00% |
| Cambodia |
20.00% |
| China |
20.00% |
| Kazakhstan |
15.00% |
| Japan |
15.00% |
| Macau |
12.00% |
| Myanmar |
10.00% |
| Indonesia |
5.00% |
| Georgia |
5.00% |
|
Malaysia |
5.00% |
| Mongolia |
2.00% |
| Vietnam |
0.10% |
| Sri Lanka |
0.00% |
| Singapore |
0.00% |
| Hong Kong |
0.00% |
| Pakistan |
0.00% |
| |
|
|
Asia: Price changes, 1 year (%)
The annual (year-on-year) percentage change in
house prices (or the house price index) using the
latest data available, not adjusted for inflation.
(according to Global Property Guide)
Price Change 1 yr
| Hong Kong |
14.79% |
| Macau |
12.10% |
| Philippines |
10.19% |
| India |
8.70% |
|
Malaysia |
5.56% |
| Indonesia |
3.32% |
| Japan |
3.28% |
| South Korea |
1.47% |
| China |
1.35% |
| Vietnam |
0.32% |
| Taiwan |
0.23% |
| Thailand |
0.23% |
| Mongolia |
-0.20% |
| Singapore |
-0.22% |
| |
|
|
Asia: Price changes, 5 years (%)
The percentage changes in house prices (or the
house price index) over 5 years using the latest
data available, not adjusted for inflation.
(according to Global Property Guide)
Price Change 5 yrs
| China |
92.07% |
| India |
76.16% |
| Macau |
70.27% |
| Philippines |
67.26% |
| Hong Kong |
56.11% |
|
Malaysia |
48.59% |
| Indonesia |
35.37% |
| Japan |
34.51% |
| Thailand |
19.64% |
| Taiwan |
14.51% |
| South Korea |
6.92% |
| Vietnam |
0.65% |
| Singapore |
-7.53% |
| |
|
|
Asia: Price changes, 10 years (%)
The percentage changes in house prices (or the
house price index) over 10 years using the latest
data available, not adjusted for inflation.
(according to Global Property Guide)
Price Change 10 yrs
| Macau |
367.09% |
| Hong Kong |
222.89% |
| Philippines |
114.48% |
| Taiwan |
80.37% |
| Indonesia |
59.00% |
|
Japan |
26.36% |
| South Korea |
24.40% |
| Singapore |
20.28% |
|
Asia: Landlord and tenant laws
The amount of control the landlord has over his
property, measured on a five-point rating scale:
Strongly Pro-landlord = 2
Pro-landlord = 1 Neutral = 0
Pro-tenant = -1
Strongly Pro-tenant= - 2 (according
to Global Property Guide)
Landlord & Tenant Law
|
Strongly Pro Tenant |
Pro Tenant |
Neutral |
Pro Landlord |
Strongly Pro
Landlord |
|
| Japan |
|
| Vietnam |
|
| Hong Kong |
|
| Philippines |
|
| Taiwan |
|
| Thailand |
|
| Singapore |
|
| South Korea |
|
| Sri Lanka |
|
| Cambodia |
|
| China |
|
| Armenia |
|
| Georgia |
|
| Pakistan |
|
| Indonesia |
|
| India |
|
|
Malaysia |
|
|
Strongly Pro Tenant |
Pro Tenant |
Neutral |
Pro Landlord |
Strongly Pro
Landlord
|
|
|
Asia: GDP per capita.
The gross domestic product (GDP) per capita is
the national output, divided by the population,
expressed in U.S dollars per person, for the latest
year for which data is published. (according to
Global Property Guide)
GDP per Capita
| Macau |
$69,559 |
| Singapore |
$52,961 |
| Hong Kong |
$43,561 |
| Japan |
$38,883 |
| South Korea |
$27,535 |
| Brunei |
$26,935 |
| Taiwan |
$22,497 |
| Maldives |
$11,984 |
|
Malaysia
|
$9,374 |
| China |
$8,123 |
| Kazakhstan |
$7,456 |
| Turkmenistan |
$6,622 |
| Thailand |
$5,902 |
| Azerbaijan |
$3,956 |
| Georgia |
$3,872 |
| Sri Lanka |
$3,789 |
| Mongolia |
$3,660 |
| Indonesia |
$3,604 |
| Armenia |
$3,533 |
| Philippines |
$2,927 |
| Bhutan |
$2,681 |
| Laos |
$2,394 |
| Timor-Leste |
$2,230 |
| Vietnam |
$2,172 |
| Uzbekistan |
$2,133 |
| India |
$1,742 |
| Pakistan |
$1,441 |
| Bangladesh |
$1,414 |
| Cambodia |
$1,278 |
| Myanmar |
$1,232 |
| Kyrgyztan |
$1,073 |
| Tajikistan |
$800 |
| Nepal |
$733 |
| Afghanistan |
$582 |
| |
|
|
Asia: GDP per capita growth, 1 year (%).
The percentage change in real GDP per capita for
the latest year for which data is published.
(according to Global Property Guide)
GDP/Cap Rise 1yr
| Uzbekistan |
6.52% |
| Bangladesh |
6.08% |
| China |
6.08% |
| India |
5.72% |
| Laos |
5.50% |
| Cambodia |
5.46% |
| Myanmar |
5.29% |
| Vietnam |
5.09% |
| Philippines |
4.83% |
| Turkmenistan |
4.75% |
| Tajikistan |
4.70% |
| Bhutan |
4.54% |
|
Indonesia |
3.70% |
| Sri Lanka |
3.67% |
| Georgia |
3.28% |
| Thailand |
3.02% |
|
Malaysia
|
2.75% |
| Pakistan |
2.51% |
| South Korea |
2.36% |
| Kyrgyztan |
2.28% |
| Maldives |
2.19% |
| Taiwan |
1.27% |
| Hong Kong |
1.25% |
| Japan |
1.05% |
| Singapore |
0.68% |
| Armenia |
0.18% |
| Kazakhstan |
-0.36% |
| Mongolia |
-0.52% |
| Nepal |
-0.77% |
| Macau |
-1.85% |
| Afghanistan |
-1.90% |
| Brunei |
-3.85% |
| Azerbaijan |
-3.87% |
| Timor-Leste |
-10.25% |
|
Asia: GDP/cap growth, 5 years (%).
The percentage change in GDP per capita for the
latest 5 years for which data is published.
(according to Global Property Guide)
GDP/Cap Rise 5yrs
| Turkmenistan |
30.15% |
| China |
29.20% |
| Uzbekistan |
29.00% |
| Myanmar |
28.58% |
| Laos |
25.90% |
| India |
25.57% |
| Cambodia |
24.37% |
| Bangladesh |
23.61% |
| Vietnam |
21.29% |
| Tajikistan |
19.49% |
| Philippines |
19.38% |
| Georgia |
18.52% |
| Mongolia |
17.30% |
|
Indonesia |
15.81% |
| Maldives |
15.69% |
| Sri Lanka |
15.44% |
| Kyrgyztan |
14.87% |
| Bhutan |
13.85% |
|
Malaysia
|
13.33% |
| South Korea |
10.10% |
| Armenia |
9.95% |
| Pakistan |
9.53% |
| Nepal |
9.14% |
| Thailand |
8.54% |
| Hong Kong |
7.76% |
| Taiwan |
7.63% |
| Singapore |
7.12% |
| Kazakhstan |
6.68% |
| Japan |
5.04% |
| Azerbaijan |
2.61% |
| Afghanistan |
0.51% |
| Brunei |
-12.43% |
| Macau |
-23.87% |
| Timor-Leste |
-33.53% |
|
Asia: Economic freedom rating
Scores are from 0 to 100, higher scores are
more desirable i.e. more conducive to economic
growth. The lower the score, the greater the level
of government interference in the economy and the
less economic freedom a country enjoys. (according
to Global Property Guide)
Economic Freedom
| Hong Kong |
89.82 |
| Singapore |
88.58 |
| Taiwan |
76.51 |
| Georgia |
75.99 |
| South Korea |
74.26 |
|
Malaysia
|
73.78 |
| Macau |
70.67 |
| Armenia |
70.31 |
| Brunei |
69.77 |
| Japan |
69.58 |
| Kazakhstan |
68.99 |
| Thailand |
66.22 |
| Philippines |
65.61 |
| Azerbaijan |
63.60 |
| Indonesia |
61.94 |
| Kyrgyztan |
61.13 |
| Cambodia |
59.52 |
| Bhutan |
58.45 |
| Tajikistan |
58.17 |
| China |
57.40 |
| Sri Lanka |
57.39 |
| Nepal |
55.11 |
| Bangladesh |
54.98 |
| Mongolia |
54.76 |
| Laos |
54.01 |
| Pakistan |
52.83 |
| India |
52.64 |
| Vietnam |
52.44 |
| Uzbekistan |
52.26 |
| Maldives |
50.29 |
| Afghanistan |
48.89 |
| Turkmenistan |
47.37 |
| Timor-Leste |
46.27 |
| North Korea |
4.92 |
Repressed
0 - 49.9
Mostly Unfree
50 - 59.9
Moderately Free
60 - 69.9
Mostly Free
70 - 79.9
Free
80 - 100
|
|
Asia: Economic freedom index, 5-year change
Increased economic freedom is strongly associated
with high GDP growth, and therefore with rises in
residential property prices. (according to Global
Property Guide)
Economic Freedom 5 yrs
| North Korea |
391.67% |
| Philippines |
14.90% |
| Uzbekistan |
14.11% |
| China |
12.12% |
|
Malaysia
|
11.11% |
| Indonesia |
9.82% |
| Nepal |
9.78% |
| Georgia |
9.49% |
| Tajikistan |
8.93% |
| Kazakhstan |
8.47% |
| Turkmenistan |
8.14% |
| Laos |
8.02% |
| Azerbaijan |
7.98% |
| Timor-Leste |
6.85% |
| Taiwan |
6.41% |
| South Korea |
6.24% |
| Bangladesh |
3.35% |
| Cambodia |
3.33% |
| Bhutan |
3.26% |
| Vietnam |
2.22% |
| Maldives |
2.22% |
| Armenia |
2.19% |
| Thailand |
2.03% |
| Kyrgyztan |
1.54% |
| Singapore |
1.23% |
| Hong Kong |
-0.09% |
| Sri Lanka |
-1.55% |
| Macau |
-1.57% |
| Japan |
-2.82% |
| Pakistan |
-3.43% |
| India |
-3.59% |
| Mongolia |
-10.96% |
| |
|
Unchanged
0
Worse
(-10)
Much Worse
(-10) +
Improved
(0 - 10)
Greatly Improved 10
+
|
|
Asia: Economic growth competiveness index
The Growth Competitiveness Index (GCI), aims to
quantify the quality of the macroeconomic
environment, the state of a country's public
institutions, and its level of technological
readiness. (according to Global Property Guide)
Competitiveness
| Singapore |
5.70 |
| Hong Kong |
5.50 |
| Japan |
5.50 |
| Taiwan |
5.30 |
|
Malaysia
|
5.20 |
| South Korea |
5.10 |
| China |
5.00 |
| Azerbaijan |
4.70 |
| Thailand |
4.70 |
|
Indonesia |
4.70 |
| India |
4.60 |
| Brunei |
4.50 |
| Philippines |
4.40 |
| Vietnam |
4.40 |
| Georgia |
4.30 |
| Kazakhstan |
4.30 |
| Armenia |
4.20 |
| Sri Lanka |
4.10 |
| Tajikistan |
4.10 |
| Bhutan |
4.10 |
| Nepal |
4.00 |
| Laos |
3.90 |
| Kyrgyztan |
3.90 |
| Cambodia |
3.90 |
| Mongolia |
3.90 |
| Bangladesh |
3.90 |
| Pakistan |
3.70 |
| |
|
Very Low
0 - 3.00
Low
3.01 - 3.50
Moderate
3.51 - 4.50
High
4.51 - 5.50
Very High
5.51 - 7
|
|
Asia: Property rights index
A subcomponent of the Index of Economic Freedom,
the property rights index measures the degree to
which a country's laws protect private property
rights, and the degree to which its government
enforces those laws.
Higher scores are more desirable, i.e. property
rights are better protected. Scores are from 0 to
100. (according to Global Property Guide)
Property Rights
| Singapore |
97 |
| Hong Kong |
94 |
| Japan |
89 |
| Taiwan |
86 |
|
Malaysia
|
85 |
| South Korea |
78 |
| Brunei |
63 |
| Bhutan |
60 |
| Macau |
60 |
| Kazakhstan |
56 |
| Armenia |
55 |
| India |
55 |
| Georgia |
55 |
| Mongolia |
51 |
| Thailand |
51 |
| Kyrgyztan |
51 |
| Azerbaijan |
50 |
| Vietnam |
50 |
| Philippines |
49 |
| China |
48 |
| Indonesia |
48 |
| Sri Lanka |
48 |
| Uzbekistan |
48 |
| Tajikistan |
45 |
| Maldives |
45 |
| Cambodia |
42 |
| Nepal |
37 |
| Pakistan |
36 |
| Laos |
35 |
| Bangladesh |
35 |
| North Korea |
32 |
| Turkmenistan |
32 |
| Afghanistan |
13 |
| Timor-Leste |
7 |
| |
|
|
Asia: Currency +/- valuation index
This is a cost of living indicator. The figure
shows how much how much a bundle of goods and
services costing US$1 in the US would cost in other
countries (similar to The Economist's Big Mac
Index). (according to Global Property Guide)
Currency +/- Value
| Japan |
$ 0.90 |
| South Korea |
$ 0.75 |
| Hong Kong |
$ 0.74 |
| Macau |
$ 0.70 |
| Maldives |
$ 0.66 |
| Singapore |
$ 0.59 |
| China |
$ 0.52 |
| Taiwan |
$ 0.49 |
| Timor-Leste |
$ 0.44 |
| Armenia |
$ 0.41 |
| Turkmenistan |
$ 0.40 |
| Georgia |
$ 0.39 |
| Philippines |
$ 0.37 |
| Brunei |
$ 0.36 |
| Thailand |
$ 0.36 |
| Bangladesh |
$ 0.36 |
| Cambodia |
$ 0.35 |
| Laos |
$ 0.35 |
| Vietnam |
$ 0.34 |
| Bhutan |
$ 0.33 |
| Malaysia
|
$ 0.33 |
| Kazakhstan |
$ 0.33 |
| Kyrgyztan |
$ 0.31 |
| Nepal |
$ 0.31 |
| Indonesia |
$ 0.31 |
| Uzbekistan |
$ 0.30 |
| Afghanistan |
$ 0.30 |
| Sri Lanka |
$ 0.30 |
| Mongolia |
$ 0.28 |
| India |
$ 0.26 |
| Tajikistan |
$ 0.26 |
| Azerbaijan |
$ 0.24 |
| Myanmar |
$ 0.20 |
|
Asia: Taxes on residents
The percentage of gross earnings given up in tax,
including any social security contributions.
Calculated for a single worker without children,
earning 100 % of the average wage, for selected OECD
countries. (according to Global Property Guide)
Taxes on Residents
| Uzbekistan |
6.52% |
| Bangladesh |
6.08% |
| China |
6.08% |
| India |
5.72% |
| Laos |
5.50% |
| Cambodia |
5.46% |
| Myanmar |
5.29% |
| Vietnam |
5.09% |
| Philippines |
4.83% |
| Turkmenistan |
4.75% |
| Tajikistan |
4.70% |
| Bhutan |
4.54% |
| Indonesia |
3.70% |
| Sri Lanka |
3.67% |
| Georgia |
3.28% |
| Thailand |
3.02% |
|
Malaysia
|
2.75% |
| Pakistan |
2.51% |
| South Korea |
2.36% |
| Kyrgyztan |
2.28% |
| Maldives |
2.19% |
| Taiwan |
1.27% |
| Hong Kong |
1.25% |
| Japan |
1.05% |
| Singapore |
0.68% |
| Armenia |
0.18% |
| Kazakhstan |
-0.36% |
| Mongolia |
-0.52% |
| Nepal |
-0.77% |
| Macau |
-1.85% |
| Afghanistan |
-1.90% |
| Brunei |
-3.85% |
| Azerbaijan |
-3.87% |
| Timor-Leste |
-10.25% |
|
ESSENTIAL
HIGHLIGHTS
 Malaysian
Governance 2018 Onwards Malaysian
Governance 2018 Onwards
Newly Elected
Government with New Life in May 9, 2018; In Peaceful
Transition to New Malaysia from a Debt-Driven Near Failed State
to a Successful State and is Predicted to Stabilize
Gradually over the Years; Known to actively Work
Towards a Non-Corrupt, Non-Race Divisive, More
Effective and Efficient Non-Wasting and Non-Kleptocratic
Governance with Greater Fairness, Democracy
and People-Focused but Not-Amounting to a
Welfare State
These Essential Highlights
favor future genuine investment
Without-Quotation-Mark both ways!
Genuine
vs Speculative Investment
Although speculative
property investment at Iskandar Malaysia is
marginally promising, a foothold on such unique and
strategically located property long-term as
Malaysia My Second Home (MMH2) would open up much
business opportunities at comparatively and
reasonably low costs of living and costs of business
operation. That is why, from a long-term
genuine investment (not speculative) point of view,
the Iskandar property is still a good option to
choose from.
|
Malaysia
My Second Home (MM2H)
No government will
be stupid enough NOT to attract high-value investors
to help grow their own economy! Foreign
investors in the Iskandar Malaysia projects enjoy
the prospect of getting a Malaysian MM2H green card
making 'Malaysia My Second Home' an additional haven
a reality, which was touted as the Malaysian
equivalent of the US green card, which grants
the holder permanent resident status. However,
high-valued foreign investors might opt for
Malaysian citizenship provided comparative benefits justify
it.
|
A
Special Economic Corridor (SEC) of the Southern
Region of Johor
It is Malaysia's
Grand Strategy to attract foreign investment to this
Special Economic Zone to stimulate economic growth
and modernization of Malaysia. Like many other
special economic zones which have been successful in
other countries, this Malaysia's 'Shenzhen' is the
much
needed one. The economic growth plan
consists of 2 components, namely a Strategic
Economic Thrust for immediate implementation and a
Future Growth Scenario (2005-2025) for long-term
application.
Malaysia
National Debt
Statistics
|
|
Travel Around with
the Aim of Investment and with the help of InvestOdyssey Iskandar
Services |
Your Tailored Investment,
Business Setup and BusinessTrip InvestoPackages |
|
Journey in Iskandar
Malaysia
for the Purpose of Property Investment, Business Setup
and Business Operation |
Enquire or Book an InvestoVisit Online Now |
|
InvestoVisit Sites / Description |
|
|
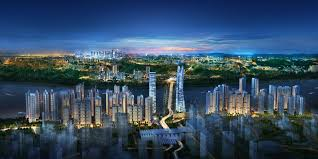
Meridin@Medini
in Iskandar Puteri, Iskandar Malaysia

ENQUIRE/ BOOK NOW
Meridin@ Medini
is located in Iskandar Puteri which is Iskandar Malaysia's special economic zone.
It is situated within a short drive from
Singapore through both the Causeway Link and the Tuas Link. A
stone's throw from Legoland, Mall of Medini, EduCity
and Gleneagles medical center. Investors enjoy special tax &
investment incentives and zero RPGT. Open for purchase to
foreigners. Investment package includes options for hotel managed
suites and rental returns.
....... Read More
|
|
|
Forest City @
Gelang Patah, Iskandar Iskandar Malaysia

ENQUIRE/ BOOK NOW
Forest City
of Iskandar Water
Margin consists of four man-made islands
in Gelang Patah, in the State of Johor, Iskandar
Malaysia just next to the
Tuas Link (2nd Link) to Singapore and the second largest Mangrove wetland in the world where
the southernmost tip (Tanjung Piai) of mainland Asia
(Eurasia) is located. It has a total land area of
1,386ha - about three times the size of Singapore
Sentosa island. A Smart
Eco-City that can acommodate an estimated population
of 700,000 residents, Forest City will offer wealthy
international buyers of luxury homes. It uses ideas
related to HEIGRENS .......
Read More
|
|
|
Country Garden @
Danga Bay, Iskandar Malaysia

ENQUIRE/ BOOK NOW
Country Garden
of Iskandar Water Margin is situated in Danga Bay, Iskandar Malaysia about 6km
to Singapore via the Causeway (1st link), and its
57-acres fully-integrated development offers a
distinct mix of exclusive residential, commercial,
financial and leisure components to complement Johor
Bahru City Centre. It is the ultimate destination
for those looking for an ideal address with melting
pot of facilities services, lifesytle and culture. It is touted as the next Sentosa. With its
comprehensive condo facilities and resort-like
ambience, it is not difficult to see why it has
become an
....... Read More
|
|
|
Greenland Helios Cove @ Tebrau Bay, Iskandar
Malaysia

ENQUIRE/ BOOK NOW
Greenland Helios Cove,
of Iskandar Water Margin in Tebrau Bay, Iskandar Malaysia was given the nod
in 2012 to set up to a ‘Smart City’ at a special
meeting of Malaysia’s Global Science and Innovation
Advisory Council (GSIAC) — a unique assembly of
all-star national and international experts created
to inform and assist the nation’s sustainable
development — chaired by Prime Minister Datuk Seri
Najib Tun Razak. A Chinese developer was given
the nod in
building an experimental centre using advanced
technology to promote the Smart City initiative.
Smart cities rely
on the widespread
....... Read More
|
|
|
Greenland
Jade Palace @ Danga Bay, Iskandar Malaysia

ENQUIRE/ BOOK NOW
Greenland Jade Palace
also called Jade Palace Danga Bay of Iskandar Water Margin, is situated on 13.6 acres of
freehold land just next to Country Garden, Danga Bay. When completed, it will contain about 2,000
housing units, according to a Greenland representative.
Greenland’s Jade Palace is considered a luxe
residential development belonging to Iskandar
Malaysia’s financial and cultural hub dubbed
Flagship Zone A. The 13-tower waterfront residences
join in the ranks of other internationally-inspired
properties such as its next door neighbour, Country
Garden.
....... Read More
|
|
|
R&F Princess Cove @ Johor Bahru, Iskandar
Malaysia
ENQUIRE/ BOOK NOW
R&F Princess Cove
of Iskandar Water Margin is located a 'Point-Zero' at the Causeway Link in Johor Bahru,
Iskandar Malaysia. R&F Princess Cove is i) FREEHOLD 2)
35-Storey Towers Facing Singapore 3) 100% Foreigner Ownership
4) in Great Rental Demand 5) a Perfect Connectivity to major
highways & future MRT to Singapore 6) in the Prime Location in
Johor Bahru City Centre 7) giving 5-Star Luxury Facilities 8)
Right above branded retail and F&B outlets. As the
developer, Guangzhou R&F Properties Co., Ltd.
pointed out clearly: R&F Princess Cove encapsulates
the HOPSCA Marina Living Concept
....... Read More
|
|
|
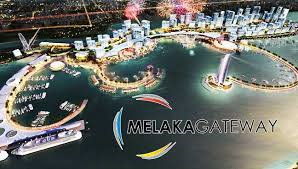
Melaka Gateway @ Pulau Melaka, Melaka
ENQUIRE/ BOOK NOW
Melaka Gateway
is an off-shore development of Pulau Melaka and artificial islands on the coast of
Malacca City, Malaysia. It is not in Iskandar Malaysia but is
still located along the Maritime Silk Road. It were launched on 7 February 2014 by
Malaysia's Prime Minister, Dato' Seri Najib Bin Tun Abdul Razak,
witnessed by Chief Minister of Malacca, Dato Wira Ir. Idris Haron.
It is expected to be open on 2018 and finished
completely by 2025. Melaka Gateway is projected to
generate an additional 2.5 million tourists over the
next 12 years. Certified as a UNESCO World Heritage
Site,
........ Read More
|

Copyright © Fourthway ManHo
Center. All Rights Reserved |
|
|

